

Week of September 21, 2026

Published every Monday: Get a detailed snapshot of what moved the markets last week—and what to watch this week.

The Federal Reserve (Fed) makes the necessary move.

A volatile week left stocks generally lower, with only the Nasdaq Composite closing higher. The health care, communication services, and technology sectors moved higher; the financials, utilities, and real estate sectors declined. The 10-year Treasury yield touched levels not seen since the 2008 financial crisis, leading to weakness in the bond market.

Weekly Quick Hits

Beyond the Headlines

The Federal Reserve (Fed) makes the necessary move.

Report Releases

The Federal Open Market Committee (FOMC) voted unanimously to raise interest rates 25 basis points (bps).


Financial Market Data

Stocks and bonds were mostly lower after a hawkish central bank meeting.

Looking Ahead

In a light week for economic data, geopolitical issues and Fed speeches will remain in focus.

BEYOND THE HEADLINES:

The Federal Reserve (Fed) makes the necessary move.

Given still-high inflation, the FOMC raised interest rates 25 bps in a unanimous decision. Although the rate hike itself was widely expected, the fact that policymakers were unanimous came as a mild surprise.

More important than the rate increase itself was the message behind it: Inflation remains the Fed’s primary concern. Fed Chair Kevin Warsh reinforced that point during his post-meeting news conference, where his comments struck a notably hawkish tone.

While last week’s action provided clarity on the central bank’s near-term priorities, important questions remain about the longer-term path of interest rates.

One and Done Seems Unlikely
Twelve of the 18 participants (Warsh again chose not to participate) who submitted quarterly estimates of where they believe rates are headed (i.e., dot plots) believed that there will be at least one more rate increase this year, and four thought there would be two rate hikes.

A resolution to the war in the Middle East seems unlikely in the short term. Even if there was a peace accord, it’s unlikely the Strait of Hormuz could reopen quickly enough to bring meaningful relief to crude oil prices soon. That means inflation data is likely to remain elevated—and above the Fed’s 2 percent target—at central bank meetings in October and December.

Although the Fed has emphasized that future decisions will remain data-dependent, current conditions suggest that another interest rate increase before year-end remains a realistic possibility.

Next Year Is Less Clear
Despite the building consensus among Fed members on the remainder of the year, 2027 is less clear. Eight of the 18 participants (nearly a 50-50 split) see interest rates increasing again next year.

Given the uncertainty surrounding the war in the Middle East, the split isn’t surprising. If and how that situation is resolved will determine how many times the Fed needs to raise rates to lower inflation.

The key going forward is whether higher oil prices begin to affect other inflation components, especially core goods. If they do, rates are likely to move higher in 2027.

The Bond Market Approves
The rise in the 10-year Treasury yield heading into the Fed’s meeting sent a clear message. Warsh had raised the stakes on fighting inflation and earned his hawkish reputation. By raising rates and presenting a largely unified front, policymakers reinforced their commitment to fighting inflation. The reaction in the bond market suggested that the FOMC has earned credibility in the inflation battle.

It’s now clear, in hindsight, that the pause in the interest rate–reduction cycle in late 2025 was not a pause before further rate cuts. The critical question now is whether this is the start of another tightening cycle for short-term rates that lasts into next year, or whether it represents only one or two rate increases that reverse the insurance rate cuts of last year. If it’s the latter, yields on long-term Treasury bonds could be close to a peak.


“By raising rates and presenting a largerly unified front, policymakers reinforced their commitment to fighting inflation. The reaction in the bond market suggested that the FOMC has earned credibility in the inflation battle

Report Releases: September 14-18, 2026

Advance Retail Sales:
August (Tuesday)

Retail sales came in well above economists’ estimates, with headline and core sales rebounding sharply last month after falling in July.

  • Expected/prior month retail sales monthly change: +0.8%/–0.5%
  • Actual retail sales monthly change: +1.2%

National Association of Home Builders (NAHB) Housing Market Index:
September (Tuesday)

Home builder confidence fell to its lowest level since 2022 due to rising mortgage rates and increased material costs.

  • Expected/prior month NAHB Housing Market Index: 34/35
  • Actual NAHB Housing Market Index: 32

FOMC Rate Decision:
September (Wednesday)

The FOMC hiked the range for the federal funds rate by 25 bps after its September meeting and signaled a willingness to raise rates further.

  • Expected/prior federal funds rate upper limit: 4.00%/3.75%
  • Actual federal funds rate upper limit: 4.00%

Housing Starts and Building Permits:
August (Wednesday)

Housing starts and building permits fell more than expected last month, which could signal additional weakness in the housing market.

  • Expected/prior month housing starts monthly change: +6.7%/–9.0%
  • Actual housing starts monthly change: –2.6%
  • Expected/prior month building permits monthly change: –1.5%/+4.3%
  • Actual building permits monthly change: –2.7%

The Takeaway


  • The Fed’s interest rate hike and commitment to returning inflation to its 2 percent target was the week’s major takeaway.
  • Although housing-sector updates showed continued weakness, retail sales exceeded expectations.

Financial Market Data

Equity

Global stocks were mostly lower. Strength in the communication services and technology sectors helped the Nasdaq Composite buck the trend and rise 0.73 percent. The Dow Jones Industrial Average was hampered by weakness in financials and closed down more than 1.6 percent. Health care was the best-performing sector, rising 1.76 percent. With the 10-year Treasury yield touching highs last seen in 2008, interest rate–sensitive sectors such as utilities and real estate came under pressure. International developed markets and emerging markets also finished the week lower.
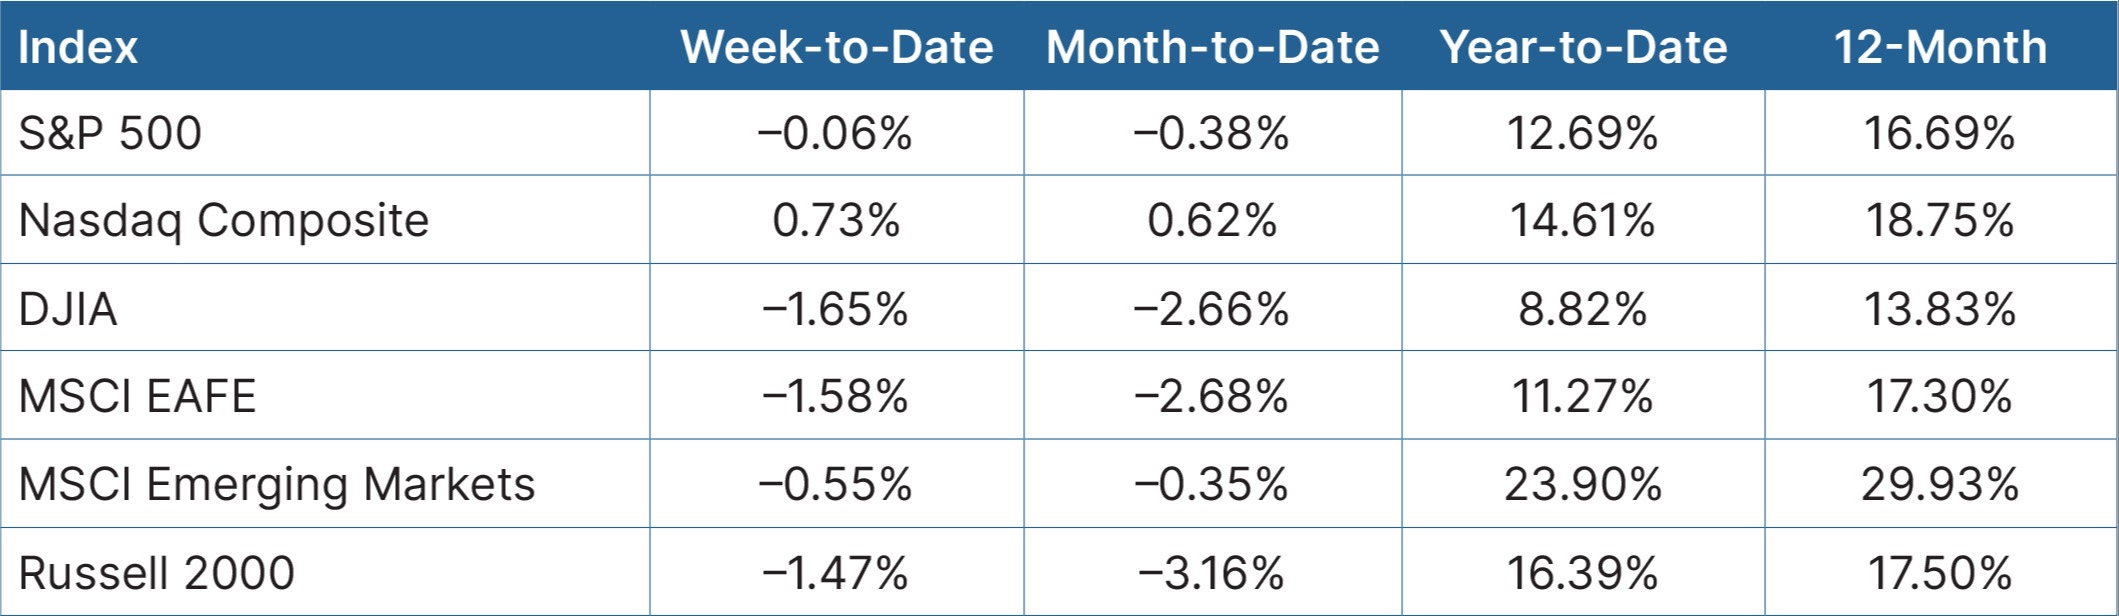
equity graph

Source: Bloomberg, as of September 18, 2026

Fixed Income

The 10-year Treasury yield reached levels last seen 18 years ago. The Fed’s dot plot and Chair Warsh’s post-meeting news conference were deemed hawkish because they reinforced the message that the central bank remains focused on bringing inflation back to its 2 percent target. As a result, fixed income markets were lower. Core bonds, Treasuries, and mortgages declined marginally, while the municipal market dropped slightly more.
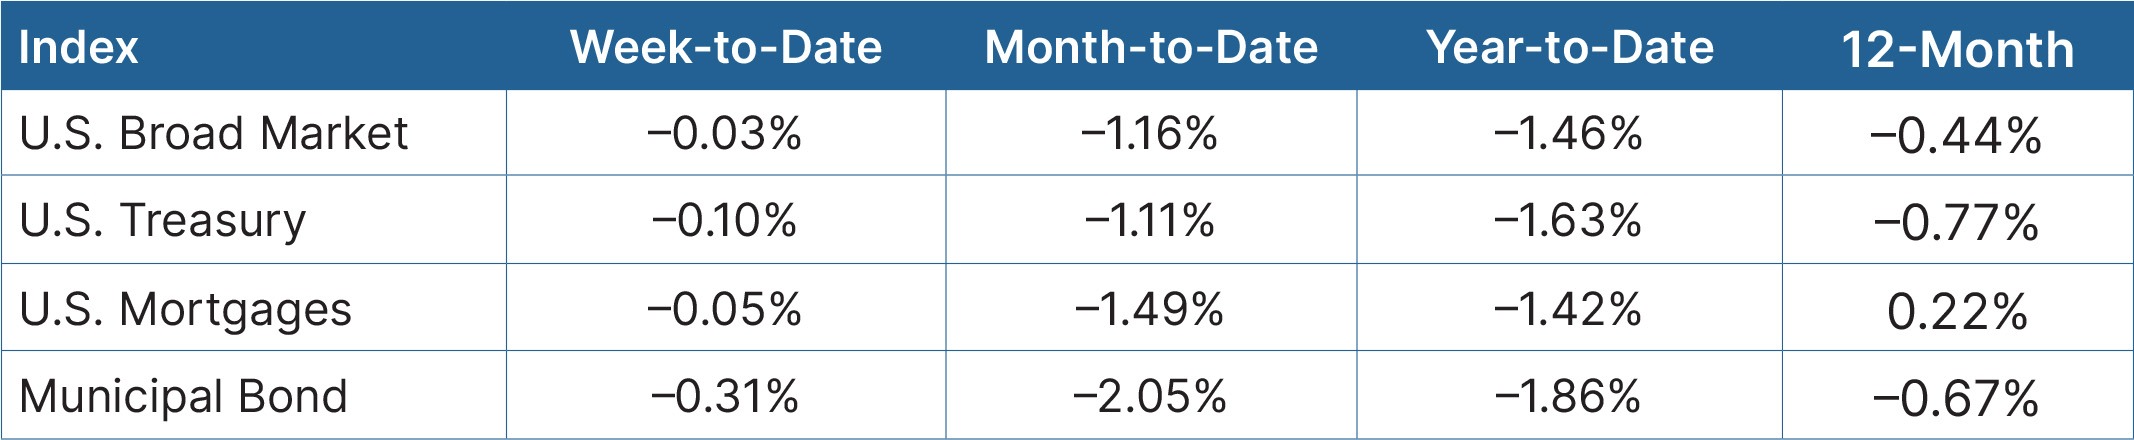
fixed income graph

Source: Bloomberg, as of September 18, 2026

The Takeaway


  • Stocks were mostly lower, with only the tech-heavy Nasdaq Composite closing higher. The Dow Jones Industrial Average closed sharply lower on weakness in the financial sector.
  • With the yield on the 10-year Treasury reaching levels not seen for nearly two decades, fixed income markets were lower.

Looking Ahead

It will be a light week for economic data, with durable goods being the most noteworthy report.

  • On Thursday, we expect an update on preliminary durable goods orders for August. Orders are expected to fall after improving in July; however, headline and core durable goods orders are expected to continue growing.

Disclosure: This material is intended for informational/educational purposes only and should not be construed as investment advice, a solicitation, or a recommendation to buy or sell any security or investment product. Diversification does not assure a profit or protect against loss in declining markets, and diversification cannot guarantee that any objective or goal will be achieved. Please contact your financial professional for more information specific to your situation.

Bonds are subject to availability and market conditions; some have call features that may affect income. Bond prices and yields are inversely related: when the price goes up, the yield goes down, and vice versa. Market risk is a consideration if sold or redeemed prior to maturity.

Certain sections of this commentary contain forward-looking statements that are based on our reasonable expectations, estimates, projections, and assumptions. Forward-looking statements are not guarantees of future performance and involve certain risks and uncertainties, which are difficult to predict. All indices are unmanaged and are not available for direct investment by the public. Past performance is not indicative of future results. The S&P 500 is based on the average performance of the 500 industrial stocks monitored by Standard & Poor’s. The Nasdaq Composite Index measures the performance of all issues listed in the Nasdaq Stock Market, except for rights, warrants, units, and convertible debentures. The Dow Jones Industrial Average is computed by summing the prices of the stocks of 30 large companies and then dividing that total by an adjusted value, one which has been adjusted over the years to account for the effects of stock splits on the prices of the 30 companies. Dividends are reinvested to reflect the actual performance of the underlying securities. The MSCI EAFE Index is a float-adjusted market capitalization index designed to measure developed market equity performance, excluding the U.S. and Canada. The MSCI Emerging Markets Index is a market capitalization-weighted index composed of companies representative of the market structure of 26 emerging market countries in Europe, Latin America, and the Pacific Basin. The Russell 2000® Index measures the performance of the 2,000 smallest companies in the Russell 3000® Index. The Bloomberg US Aggregate Bond Index is an unmanaged market value-weighted performance benchmark for investment-grade fixed-rate debt issues, including government, corporate, asset-backed, and mortgage-backed securities with maturities of at least one year. The U.S. Treasury Index is based on the auctions of U.S. Treasury bills, or on the U.S. Treasury’s daily yield curve. The Bloomberg US Mortgage Backed Securities (MBS) Index is an unmanaged market value-weighted index of 15- and 30-year fixed-rate securities backed by mortgage pools of the Government National Mortgage Association (GNMA), Federal National Mortgage Association (Fannie Mae), and the Federal Home Loan Mortgage Corporation (FHLMC), and balloon mortgages with fixed-rate coupons. The Bloomberg US Municipal Index includes investment-grade, tax-exempt, and fixed-rate bonds with long-term maturities (greater than 2 years) selected from issues larger than $50 million. One basis point is equal to 1/100th of 1 percent, or 0.01 percent.

Authored by the Investment Research team at Commonwealth Financial Network®.

© 2026 Commonwealth Financial Network®

Let’s Talk About Your Financial Future

Whether you’re navigating a volatile market or preparing for the future, we’re here to help.

Schedule a Consultation